Building source transparent databases from historical sources.

A programmatical approach to the Chineese postman problem.
Montecarlo testing of a classic problem in combinatorics.
Unusual applications of network visualisation tools.
Doctoral thesis in Economic History - Umeå University.
When you download a historical dataset and start running regressions, you're trusting a long chain of decisions you never saw being made. Someone scanned a ledger, someone else typed a number, someone decided that "Ams. Bank" and "Amsterdamsche Bank" referred to the same firm. By the time the data reaches you, those decisions are invisible - and usually irreversible.
Think of it as a scale. On the far left: raw scanned images straight off the archive shelf. On the far right: a clean variable ready for a regression. Between those two extremes lies a series of transformations - OCR, case corrections, entity recognition, grouping, matching. Each step nudges the data a little further right. The idea is not to avoid moving right. The idea is to record every step along the way, so the path back to the left is never closed off. Sounds obvious in principle. Turns out to be rather easy to get wrong in practice.
Undertaken at the Groningen University, the Van 'Oss financial yearbook has undergone a digitalisation that keeps the link to the source intact. The source lists companies traded on the Amsterdam stock exchange and packs balance sheets, profit-and-loss statements, stock price histories, and company descriptions into dense, semi-structured pages. Over 150,000 scanned images, across decades of evolving printing standards and variable layouts.
A workflow takes the professional scans through image pre-processing (de-skewing and horisontalisation of written lines), OCR, line detection, block detection of layout elements and adapted data extraction parsing specific to the block type.
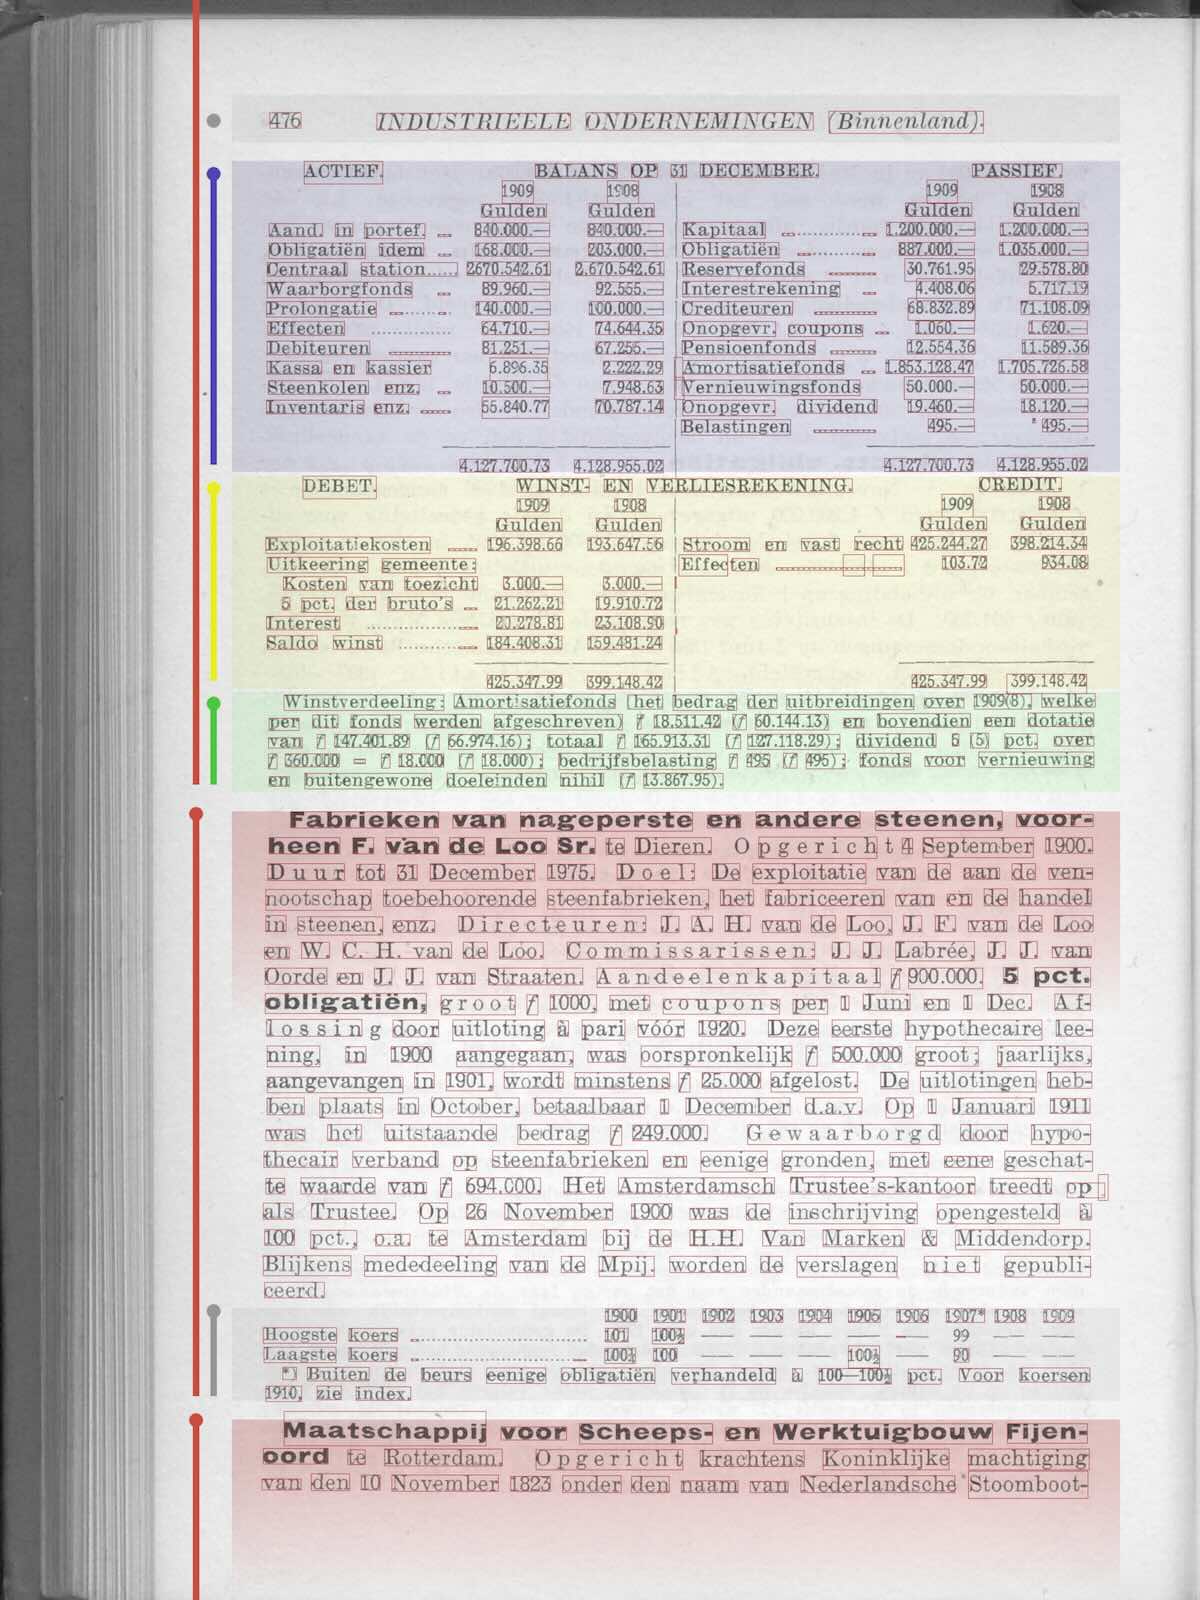
In the source, a hierarchy is made so that the source is divided into years, each year in up to two volumes, each volume in chapters. Chapters contain pages. Pages are divided into company entries spanning one or many pages. Each company entry contain indistinguishable blocks of table types and semi-structured free-text data. The hierarchy for a given page is illustrated here.
The outcome is a database where every given data-point of a given table can be traced back to the original source scan. The intermediary steps of matching, corrections or variable classifications are stored.
A lot of research never needs this. The cleaned data point is perfectly sufficient. But the option to go back should be there. During the database building, returning to edit previous iterations of the data curation can be crucial. To the researcher that works with the ready database, an easy step to access the actual source files can inspire to scrutinise outliers, re-evaluate cases, find interesting anecdotes of representative or divergent cases that better helps to tell the story that the data supports.
The Van 'Oss books are viewable in part at vanoss.online. The document structure is browsable for 1903-1920, but no high-resolution parsed tables
My doctoral thesis (published here) in 2019 is a study of emerging market structures and corporate strategies related to different kinds of interfirm corporate relations and resource sharing. It is a historic case study of 75 years of property insurance and proposes a new history of that industry in Sweden.
The study proposes a network perspective on the organisation of competition and collaboration. It finds that networks lowered firms’ cost threshold for underwriting diversification, causing well-connected firms to expand into new markets more easily. An essential resource to underwriters was information, and information exchange motivated several interfirm rapprochements. The driving forces for the organisational shift towards increased networking were, however, complex, and included both socioeconomic and strategic factors.

Bump chart over leading Swedish property underwriters and their market-share by insurance premiums.
Through networks of mutual resource sharing, the consolidation that occurs in the industry after 1950 was preceded by a long historical process in which firms who would later merge developed measurably clustered network structures as early as in the 1910s. In the 1920s the networks already contributed to a high, but partly hidden, market concentration. Networks thereby conditioned the underwriting operation of individual firms as well as the structural evolution of the Swedish insurance market as a whole.
The birthday paradox refers to the (often intuitively underestimated) s-shaped relation between group size and the probability that any two personsof a group shares the same birthday. As group size increases, the likelyhoodthat members share the same birthday increases also. In groups larger thanonly 22 people, it is more likely than not that at least two people sharethe same birthday - a paradox in that most people would intuitively think that a much larger group would be needed in order for a within-group same birthday to be posisble.
The probabilities of a same birthday (date only) occurring within a group can be verified using both old-school probabilistic calculations andrandomized simulations of groups of different sizes. This graph illustrates the increasing probability of same birthdays starting with 1/365 for a group of two.

The probabalistic and iterative solutions show well-converging results already at 100 iterations per group-size. R is good at these kind of operations and even 10'000 iterations (700'000) simulations, are very fast.
The reason why the breaking poont in the birthday paradox is unexpectadlylow is based in the increased number of pairwise possibilities of a samebirthday (which can be any of 365 days of the year) may occur. In any groupof [n] people, the number of unique birthday tests is expressed by:n(n-1) / 2
The conditions of the above example is simplified so that a year always contains 365 possible birthdays. No kinship, seasonal variations, or other biases are asumed to affect the independence of each persons' birthday or the equal likelihood of any of the 365 days of a year to bepossible birthdays.
Check out my git repositories a pedagogical script in R.
In network analysis, a graph contains eulerian cycles if one can visit all nodes without travelling any of its edges more than once. The problem, commonly known as the Chinese postman problem or the Seven Bridges of Königsberg was solved by mathematical father-figure Leonard Euler in the 18th century as an answer to the question if one could pass across neighbourhoods of Prussian Königsberg without crossing any of its bridges more than once. The answer was no. But what is the minimum number of bridges one would have had to construct to enable a Eulerian cycle?
 Old bridge
 Euler's new bridge
Carl Hierholzer (1873) had explained how eulerian cycles exist for graphs that are 1) connected, and 2) contain only vertices with even degrees. In a pedagogical script answering a stack overflow question, I wrote this function in R which takes any graph and attempts to make minimal manipulations of it to achieve a structure where a eulerian path is possible.
Visit my
stackexchange answer
or
download the scripts
written in R:
Since the late 1990s, the Eurovision Song Contest has applied a system of per-country telephone votes. The voting patterns have been argued to contain predictable themes, such as mutually high points awarded between Greece and Cyprus,or between the Scandinavian countries.
Using a community-detection algorithm that assigns groups of countries based on the voting networks between 1999 and 2024, an interesting pattern emerges. The sum of points given between each pair of participating countries is much stronger between certain country-pairs than between others.

The cluster analysis is based on a cut-off algorythm where clusters are found where within-community mutual voting is significatnly stronger than outside-comunity votes. The visualisation uses the Fruchterman-Reingold algorythm and draws same-community countries in proximity. Country-size represents total number of points recieved 1999-2019.
Telephone voters of culturally close countries are found to appreciate the musical contributions of their in-group members. The country-groups found using the voter patterns show that cultural and historical clusters of countries like Scandinavia, former Yugoslavia or former Soviet states, still generally prefer the music from each other’s countries.
This visualisation uses the igraph package for R and visualises community members near each other using the Fruchterman-Reingold algorithm which takes into account the edge weights defined by the total mutual points awarded between each pair of countries in the Eurovision Song Contest finals of the past decades.
This network visualises the land borders of countries of the world. It truthfully depicts relative population sizes and honours neighbour-relations, but otherwise disregards geographic space. How does our view of the world exist in our minds?
This alternative world map was made to facilitate the re-thinking of concepts like countries and continents, and to trick the beholder into turning the attention inwards - towards the beholder of such concepts and the cognitive functions on which we rely to order and navigate in the world. We can recognise the world in it, but need to rediscover and realign the alternative map to our established perception in order to read the image.

A world map visualised by algorithmic placement of country-nodes in a network of countries joined by land-borders.
Download here
the edited pdf and the original script in R using igraph and relational data to create the world-map network.
Info-graphs communicate factual information about the world and permit us form our understanding of it. Once acquired, though, our understanding of the world is sticky. Humans rely on habits and acquired patterns to function since a constantly reevaluation of our surrounding would be cognitively exhausting. Still, sticking to old info is a cognitive bias and problematic trait in human behaviour. Public health super-lecturer Hans Rosling noted that the world view of his students corresponded roughly to the socioeconomic state of the world at the time when their teachers were children.
I am fascinated by the waking up from perceptional slumbers. The moment when captured attention or kindled interest precipitates re-thinking. Here, the statistician and the artist meet and converge over both objectives and means to, as Picaso said, brush away from the soul the dust of everyday life.
For an event at the Mind Foundation in Berlin, I was invited to participate in a collaboration with other computer scientists, artists and neuroscientists for an exposition with EDGE neuroart in 2020.
Using raw data collected from neurons in mice brains, network tools and a tweaked random network generator, these are parts of the piece that our group generated for the exhibition in Berlin.
The poster is based in structural differences between uninhibitedly random networks and the real-world structure of the observed neural networks photographed in developing mice brains.
The animation draws on principles of establishing a network structure using basic structural measurements and the consequent generation of similarly structured random networks.
Like the above poster, the use of the network methodology has been left behind in the persuite of artistic rather than analytical goals.
Email me at contact at Lilljegren dot com or fill in the following form to reach me. I am based in Brussels - Belgium.